
As the U.S. enters the final quarter of 2025, investors face a challenging backdrop: a federal government shutdown is clouding economic visibility, while the Federal Reserve is poised to continue easing cycle in response to softening data. In this quarter’s report, we explore how rate cuts, tight credit spreads, and sector rotation could shape portfolios heading into year-end.
Budget battles and data blackouts
Government closure complicates policy outlook
- The U.S. federal government has shut down as the fourth quarter begins. Historically, shutdowns have had minimal long-term economic effects, but they still leave short-term marks. Each week of a shutdown has shaved an estimated 0.1 to 0.2 percentage points off annualized real GDP growth for that quarter, with roughly half of the lost output recovered after the government reopens.
- The shutdown also disrupts the release of key economic reports on jobs, inflation, and consumer spending, leaving the Federal Open Market Committee (FOMC) with less visibility ahead of its October 29th policy meeting. These gaps complicate the Fed’s data-dependent decision-making process, potentially increasing market uncertainty.
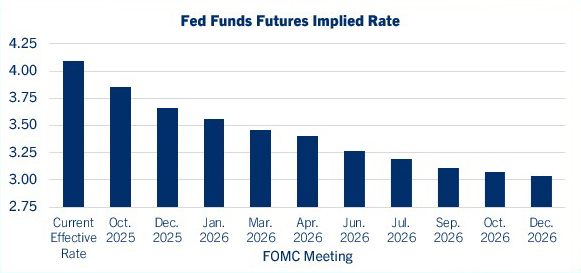
- Fed Funds futures markets are now fully pricing in a 25-basis-point rate cut in October, with a total of four to five cuts anticipated through the end of 2026. The combination of weaker data, delayed reports, and rising fiscal concerns supports expectations for an easing cycle to continue.
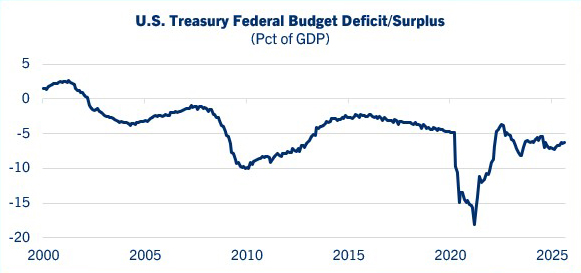
- The U.S. budget deficit for FY 2025 totaled approximately $1.8 trillion, per Congressional Budget Office (CBO) estimates. However, this figure appears $131 billion lower due to accounting changes related to the One Big Beautiful Bill Act (OBBBA), which booked 30 years of student-loan savings into a single year. This one-time adjustment does not reduce actual borrowing needs, meaning true financing requirements remain higher than last year despite the appearance of fiscal improvement.
Source: Bloomberg L.P.
Source: Bloomberg L.P.
Jobs falter, Fed follows
Soft labor data prompts rate cuts as growth remains uneven
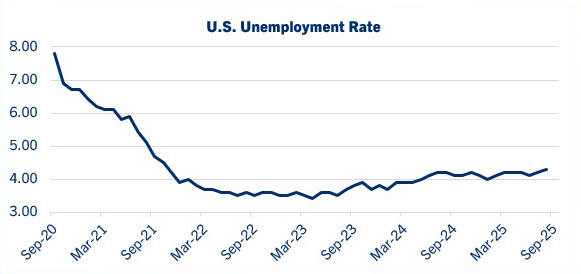
- The August jobs report was considerably weaker than expected, with anemic payrolls growth, downward revisions to prior months, and the unemployment rate edging up to the highest since late 2021. The Preliminary Benchmark Revision released September 9 made further downward revisions to payrolls and confirmed a weak trend of job growth throughout this year.
- Following these releases, the Fed cut the federal funds target a quarter percent on September 17. Comerica forecasts for the Fed to cut their target rate a quarter percent at both their late October and mid-December decisions, to a range of 3.50% to 3.75% by year-end. The Fed is also forecast to end run-off of their bond holdings (“Quantitative Tightening”) in early 2026.
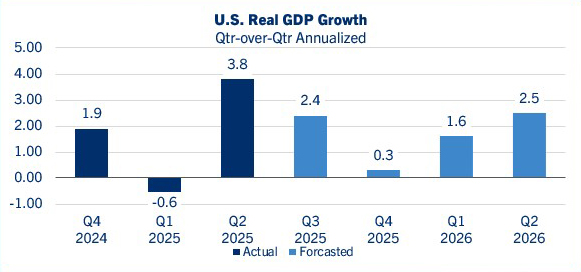
- Real GDP has been volatile in 2025, with a modest contraction in the first quarter followed by catchup growth in the second; Comerica forecasts a solid third quarter, as well. Some of this mid-year strength is payback after volatility of imports and inventories fueled the first quarter’s drop.
- Real GDP is forecast to hit another air pocket in the fourth quarter. The federal government shutdown that began October first will be a headwind. Tariff-fueled inflation is another nagging headache for the private sector, squeezing margins, pressuring businesses to slow-roll hiring and investment, and eating into consumers’ purchasing power.
Source: Bloomberg L.P.
Source: Comerica Bank Economics
Yields ease, spreads tighten
Market returns as of 9/30/2025
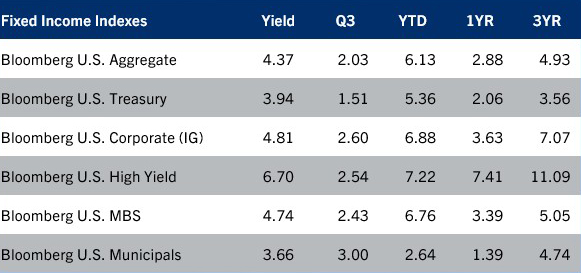
- Fixed income markets delivered positive total returns across major indexes in the third quarter. The Bloomberg U.S. Aggregate Index rose 2.0%, while municipal bonds (+3.0%), investment-grade credit (+2.6%), and high yield (+2.5%) led performance among domestic sectors. The rebound reflected both easing rates and solid investor demand across the curve.
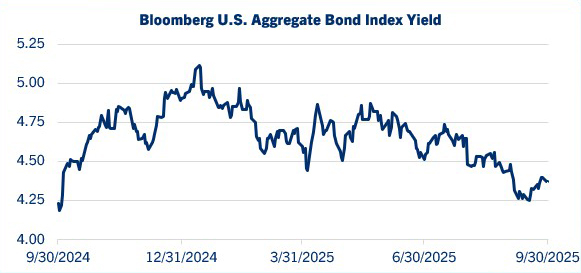
- U.S. Treasury yields drifted lower throughout the quarter, aided by declining inflation pressures and a Fed rate cut. The yield curve steepened early, as short-term yields fell faster than longer maturities, reflecting expectations for additional easing. After the rate cut, longer-dated Treasuries rallied, leading to a partial re-flattening of the curve as investors extended duration exposure.
- Corporate credit outperformed as spreads tightened significantly across both investment-grade and high-yield markets. Much of the quarter’s return was driven by spread compression rather than duration gains, suggesting investors were rewarded for taking credit risk rather than interest rate exposure.
- Indeed, corporate credit spread are extremely tight. Investment grade spreads are just 75 basis points, a multi-decade low. The spread compression reflects rising investor confidence, resilient corporate fundamentals, and modest issuance volumes.
Source: Bloomberg L.P.
Source: Bloomberg L.P.
Momentum fueled market
Market performance as of 9/30/2025
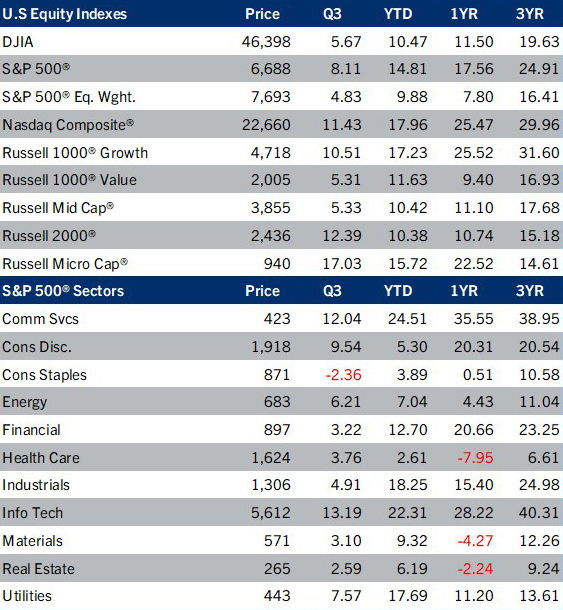
- Domestic equity markets have demonstrated resilience in 2025, with major indices posting solid double-digit gains for the year following a momentum led third quarter. The S&P 500 closed Q4 up nearly 15% year-to-date, supported by strong corporate earnings, technology sector, and growth leadership. Although the market remains led by AI and momentum stocks trading at lofty valuations, we expect value-oriented sectors to gain wider appeal as the market broadens out and relative valuations become more attractive.
- The Russell 2000 and Microcap index led the market in the quarter rising over 12% and 17% respectively reflecting a broader and healthier market that is set to benefit from lower interest rates and consumer resilience. Additionally, an increase in mergers and acquisition activity should continue to benefit small and midcap companies.
- Sector rotation has been a defining feature of 2025. Technology remained a top-performing sector, buoyed by advances in artificial intelligence, cloud computing, and semiconductor innovation. Healthcare delivered lower returns, with only biopharmaceuticals participating due to breakthrough therapies and strong demand. Energy stocks stabilized after a volatile first half, as oil prices leveled off and renewables saw increased investment. Financials improved from more favorable net interest margins and should benefit from improved asset quality and consolidation. Consumer discretionary stocks are mixed, with luxury brands outperforming mass-market retailers. Utilities have been a stand-out as demand for data centers and computing continues to grow with the expansion of networking services and hyperscalers.
Performance Reflects Total Returns. Source: Bloomberg L.P.
AI Bonanza for EM economies
Market preformance as of 9/30/2025
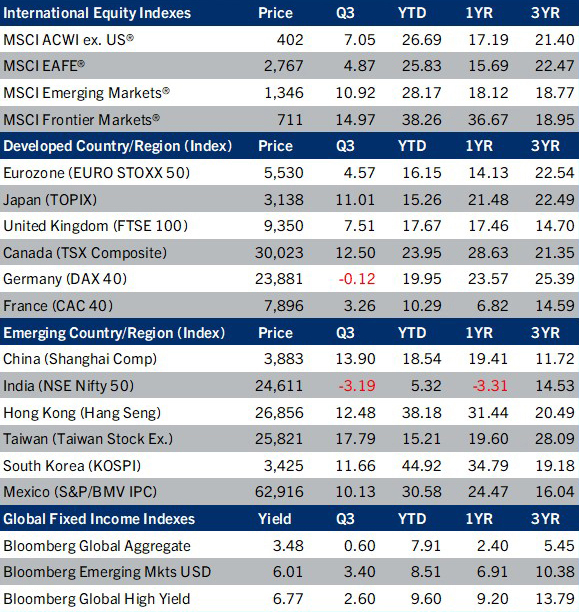
- Emerging Markets (+11% in 3Q) driven by the AI boom, specifically Asia, outpaced developed markets as measured by the EAFE index (+4.9%) .
- Taiwan (17.8% in 3Q) has been the biggest beneficiary of the US AI boom due to their exports of high-end chips. 3Q exports increased 34% YOY and their August trade surplus of $16.8B equaled 25% of GDP. Goldman Sachs revised their 2025 GDP forecast from 2.5% to 5% with 2/3rds of the growth driven by the technology sector.
- Other Asian countries in the chip/tech supply chain include Japan (11%), South Korea (11.7%), China (13.9%), Singapore & Malaysia.
- India (-3.2%) was dealt a policy shock with the US imposing a hefty new $100k fee on US companies per skilled work visa applicant. 70% of these work visa are held by Indian nationals who collectively remit $30-35B per yr to India. The expectation is that US companies will be deterred from sponsoring visa applicants in favor of an off-shore workforce. This growth obstacle, in addition to existing 50% tariffs, led investors to sell Indian equities in the 3Q driving the rupee to an all-time low of 88.8 against the US Dollar.
- China’s economy has grown faster than expected this year due to robust exports, and more recently US- China relations appear to be on a more stable path. China has leverage over the supply of ‘heavy’ rare earth minerals critical to the production of high-temperature magnets used in EVs and defense equipment. US domestic investment in mining & refining will produce ‘light’ rare earths rather than the ‘heavy’ mineral, leaving China in the catbird seat.
Performance Reflects Total Returns. Country/Region Performance in Local Currencies. Source: Bloomberg L.P.
Gold rush fever
Price levels as of 9/30/2025
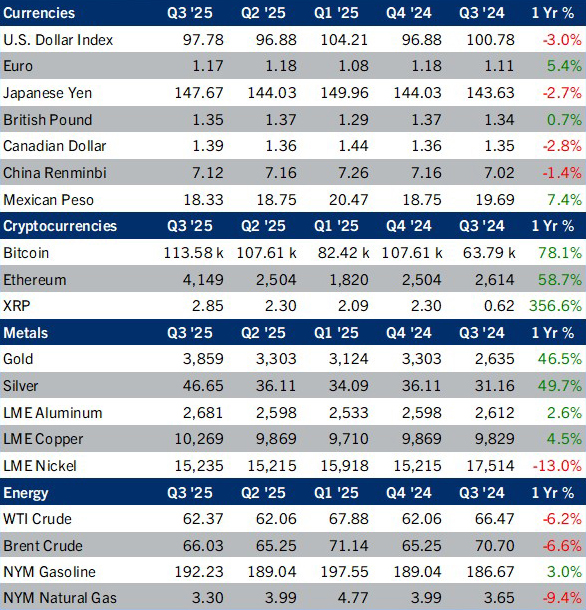
- The broad dollar DXY Index increased by almost 1% in the 3Q as the Japanese Yen and Euro currency remain under pressure. Japanese rates are expected to remain low following the election of Sanae Takaichi as leader of Japan’s ruling party, reinforcing the Yen as the preferred funding currency in ‘carry’ trades. Carry trades involve the investor borrowing in the low-rate currency to invest in the higher yielding one, placing pressure on the funding currency.
- Gold is up 46.5% YTD and continued higher in the 3Q, rising 16.8%. The rally in early 2025 which began as a hedge against US policy uncertainty, has continued, fueled by geopolitical tensions. Central banks continue to be major purchasers of gold. In addition, investor enthusiasm with both households and professional speculators, is driving the demand for Gold ETFs. Gold & crypto currencies are being viewed as ‘dollar substitutes’ allowing investors to de-risk their US dollar portfolios.
- Silver surged to all-time highs as supply constraints squeezed the London Bullion Market pushing borrowing costs to a record 35%. The price surge was sparked earlier this year by a fear that tariffs would be levied, causing a drawdown in inventories in London and bullion transfer to New York. Much of the silver in London is stored in vaults backing Silver ETFs and is not readily available for futures contact delivery.
- West Texas Intermediate Crude Oil (WTI) has remained stable in the 3Q. US production is hitting all-time highs due to technological progress and productivity growth despite the ongoing decline in the number of drilling rigs.. OPEC is trying to regain control of the market by increasing production, which bodes for continued easing in oil prices.
Source: Bloomberg L.P.
NOTE: IMPORTANT INFORMATION
All references to Comerica Bank or Comerica Bank & Trust, N.A., shall mean Fifth Third Bank, N.A., successor by merger to Comerica Bank and to Comerica Bank & Trust, N.A. All references to Comerica Incorporated shall mean Fifth Third Bancorp, successor by merger to Comerica Incorporated.
Comerica Wealth Management consists of various divisions and affiliates of Comerica Bank, including Comerica Bank & Trust, N.A. and Comerica Insurance Services, Inc. and its affiliated insurance agencies. Comerica Bank and its affiliates do not provide tax or legal advice. Please consult with your tax and legal advisors regarding your specific situation.
Non-deposit Investment products offered by Comerica and its affiliates are not insured by the FDIC, are not deposits or other obligations of or guaranteed by Comerica Bank or any of its affiliates, and are subject to investment risks, including possible loss of the principal invested.
©2026, Comerica Bank. All rights reserved
Unless otherwise noted, all statistics herein obtained from Bloomberg.
This is not a complete analysis of every material fact regarding any company, industry or security. The information and materials herein have been obtained from sources we consider to be reliable, but Comerica Wealth Management does not warrant, or guarantee, its completeness or accuracy. Materials prepared by Comerica Wealth Management personnel are based on public information. Facts and views presented in this material have not been reviewed by, and may not reflect information known to, professionals in other business areas of Comerica Wealth Management, including investment banking personnel.
The views expressed are those of the author at the time of writing and are subject to change without notice. We do not assume any liability for losses that may result from the reliance by any person upon any such information or opinions. This material has been distributed for general educational/informational purposes only and should not be considered as investment advice or a recommendation for any particular security, strategy or investment product, or as personalized investment advice.
Information supplied from another source.
While the information contained within has been provided/compiled from source(s) which are believed to be reliable and accurate to the best knowledge of Comerica Wealth Management. Comerica Wealth Management does not guarantee its accuracy. It should not be considered a comprehensive statement on any matter and should not be relied upon as such.
Past performance does not guarantee future results.
The S&P 500® Index, S&P MidCap 400 Index®, S&P SmallCap 600 Index® and Dow Jones Wilshire 500® (collectively, “S&P® Indices”) are products of S&P Dow Jones Indices, LLC or its affiliates (“SPDJI”) and Standard & Poor’s Financial Services, LLC and has been licensed for use by Comerica Bank, on behalf of itself and its Affiliates. Standard & Poor’s® and S&P® are registered trademarks of Standard & Poor’s Financial Services, LLC (“S&P”) and Dow Jones® is a registered trademark of Dow Jones Trademark Holdings, LLC (“Dow Jones”). The S&P 500® Index Composite is not sponsored, endorsed, sold or promoted by SPDJI, Dow Jones, S&P, or their respective affiliates and none of such parties make any representation regarding the advisability of investing in such product nor do they have any liability for any errors, omissions, or interruptions of the S&P Indices.
NEITHER S&P DOW JONES INDICES NOR STANDARD & POOR’S FINANCIAL SERVICES, LLC GUARANTEES THE ADEQUACY, ACCURACY, TIMELINESS AND/OR THE COMPLETENESS OF THE WAM STRATEGIES OR ANY DATA RELATED THERETO OR ANY COMMUNICATION, INCLUDING BUT NOT LIMITED TO, ORAL OR WRITTEN COMMUNCATION (INCLUDING ELECTRONIC COMMUNICATIONS) WITH RESPECT THERETO. S&P DOW JONES INDICES AND STANDARD & POOR’S FINANCIAL SERVICES, LLC SHALL NOT BE SUBJECT TO ANY DAMAGES OR LIABILITY FOR ANY ERRORS, OMISSIONS, OR DELAYS THEREIN. S&P DOW JONES INDICES AND STANDARD & POOR’S FINANCIAL SERVICES, LLC MAKE NO EXPRESS OR IMPLIED WARRANTIES, AND EXPRESSLY DISCLAIM ALL WARRANTIES, OR MERCHANTABILITY OR FITNESS FOR A PARTICULAR PURPOSE OR USE OR AS TO RESULTS TO BE OBTAINED BY COMERICA AND ITS AFFILIATES, OR ANY OTHER PERSON OR ENTITY FROM THE USE OF THE S&P INDICES OR WITH RESPECT TO ANY DATA RELATED THERETO. WITHOUT LIMITING ANY OF THE FOREGOING, IN NO EVENT WHATSOEVER SHALL S&P DOW JONES INDICES OR STANDARD & POOR’S FINANCIAL SERVICES, LLC BE LIABLE FOR ANY INDIRECT, SPECIAL, INCIDENTAL, PUNITIVE, OR CONSEQUENTIAL DAMAGES INCLUDING BUT NOT LIMITED TO, LOSS OF PROFITS, TRADING LOSSES, LOST TIME OR GOODWILL, EVEN IF THEY HAVE BEEN ADVISED OF THE POSSIBILITY OF SUCH DAMAGES, WHETHER IN CONTRACT, TORT, STRICT LIABILITY, OR OTHERWISE. THERE ARE NO THIRD-PARTY BENEFICIARIES OF ANY AGREEMENTS OR ARRANGEMENTS BETWEEN S&P DOW JONES INDICES AND COMERICA AND ITS AFFILIATES, OTHER THAN THE LICENSORS OF S&P DOW JONES INDICES.
“Russell 2000® Index and Russell 3000® Index” are trademarks of Russell Investments, licensed for use by Comerica Bank. The source of all returns is Russell Investments. Further redistribution of information is strictly prohibited.
MSCI EAFE® is a trademark of Morgan Stanley Capital International, Inc. (“MSCI”). Source: MSCI. MSCI makes no express or implied warranties or representations and shall have no liability whatsoever with respect to any MSCI data contained herein. The MSCI data may not be further redistributed or used as a basis for other indexes or any securities or financial products. This report is not approved, endorsed, reviewed or produced by MSCI. None of the MSCI data is intended to constitute investment advice or a recommendation to make (or refrain from making) any kind of investment decision and may not be relied on as such.
FTSE International Limited (“FTSE”)© FTSE 2016. FTSE® is a trademark of London Stock Exchange Plc and The Financial Times Limited and is used by FTSE under license. All rights in the FTSE Indices vest in FTSE and/or its licensors. Neither FTSE nor its licensors accept any liability for any errors or omissions in the FTSE Indices or underlying data.