
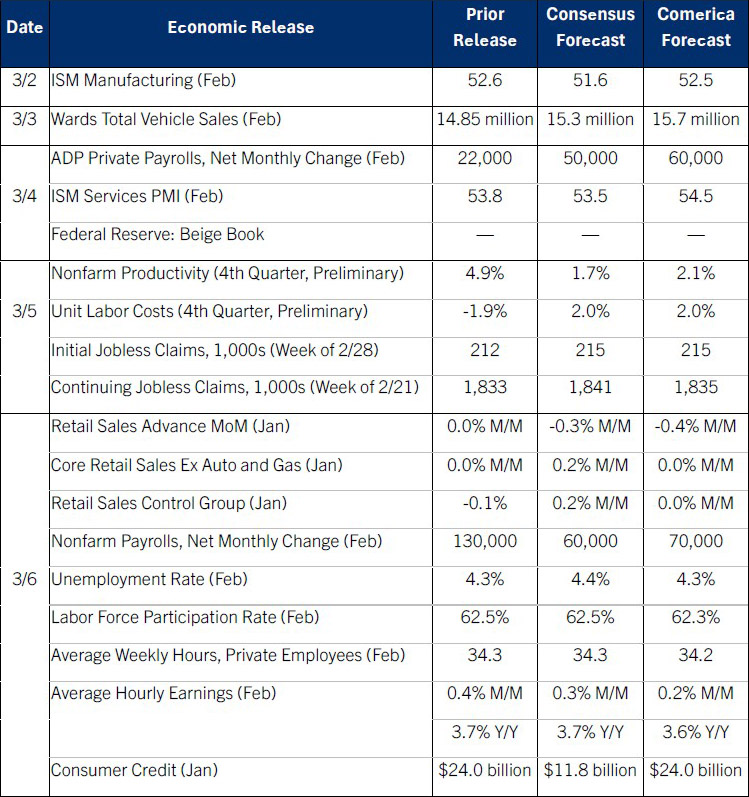
Preview of the Week Ahead
The U.S. likely registered another month of job growth outpacing last year’s meager rate in February, with the unemployment rate holding steady. Annual benchmark revisions to the household survey will likely draw headlines; this is the survey from which the unemployment rate is derived. This monthly survey covers about 60,000 households, just a sliver of the country’s 275 million people over age 16. Once a year, the BLS incorporates detailed population data from the Census Bureau to re-weight responses to the survey according to demographic characteristics like sex, age, race, national origin, and so forth. These “population control” revisions include data on immigration and so will almost certainly revise down the levels of the labor force, employment, and unemployment. Post-revision, the household survey may well show that employment fell over the last 12 months. From the Fed’s perspective, the most important output of these revisions is whether they meaningfully adjust the unemployment rate. If the unemployment rate is largely unchanged, the Fed is still very likely to hold rates steady at their next decision March 18.
This week will also see the release of January’s retail sales data, which are likely to come in weak due to headwinds from the severe winter weather that swept the country during the month.
The Week in Review
House price indexes closed 2025 with modest increases, helping to ease the economy’s affordability strains. The FHFA Purchase-Only House Price Index (HPI) edged up 0.1% in December, while the S&P Cotality Case-Shiller 20-City HPI rose 0.5%. From a year earlier, the FHFA HPI rose 1.8% and the Case-Shiller rose 1.4%. According to S&P’s data, Chicago, New York, and Cleveland saw above-average price increases in 2026, while prices fell in a number of metros that added housing supply aggressively in the post-pandemic expansion, including Tampa, Denver, Phoenix, Dallas, and Miami.
PPI inflation spiked higher than expected in January on a jump in wholesaler margins as businesses passed on tariff costs. The PPI rose 0.5% from December, above the 0.3% consensus, and core PPI excluding foods and energy jumped 0.8%. Trade services (wholesale margins) spiked 2.5% as professional and commercial equipment wholesaling margins surged 14.4% after falling 8.6% in December. This category includes wholesalers of IT products, office equipment, dental and medical supplies; strong demand for IT equipment from the AI boom is contributing to inflation in this category. Foods prices fell 1.5% and energy prices fell 2.7%. From a year earlier, the PPI rose 2.9%, while core PPI excluding foods and energy rose 3.6%. Core goods PPI excluding foods and energy registered its largest year-over-year increase since early 2023, rising 4.3%.
The Conference Board’s Consumer Confidence Index® rose to 91.2 in February from an upwardly revised 89.0 in January. The modest improvement still left the index near the lowest since the current expansion took off. Tax refunds could help explain why consumers felt a little better: The Treasury Department reports that individual tax refunds are up 32% in the year through February 24. Consumers’ views of the job market improved slightly but were still near the weakest since early 2021.
For a PDF version of this publication, click here: Comerica Economic Weekly, March 2, 2026
The articles and opinions in this publication are for general information only, are subject to change without notice, and are not intended to provide specific investment, legal, accounting, tax or other advice or recommendations. The information and/or views contained herein reflect the thoughts and opinions of the noted authors only, and such information and/or views do not necessarily reflect the thoughts and opinions of Comerica or its management team. This publication is being provided without any warranty whatsoever. Any opinion referenced in this publication may not come to pass. We are not offering or soliciting any transaction based on this information. You should consult your attorney, accountant or tax or financial advisor with regard to your situation before taking any action that may have legal, tax or financial consequences. Although the information in this publication has been obtained from sources we believe to be reliable, neither the authors nor Comerica guarantee its timeliness or accuracy, and such information may be incomplete or condensed. Neither the authors nor Comerica shall be liable for any typographical errors or incorrect data obtained from reliable sources or factual information.