

The Week Ahead
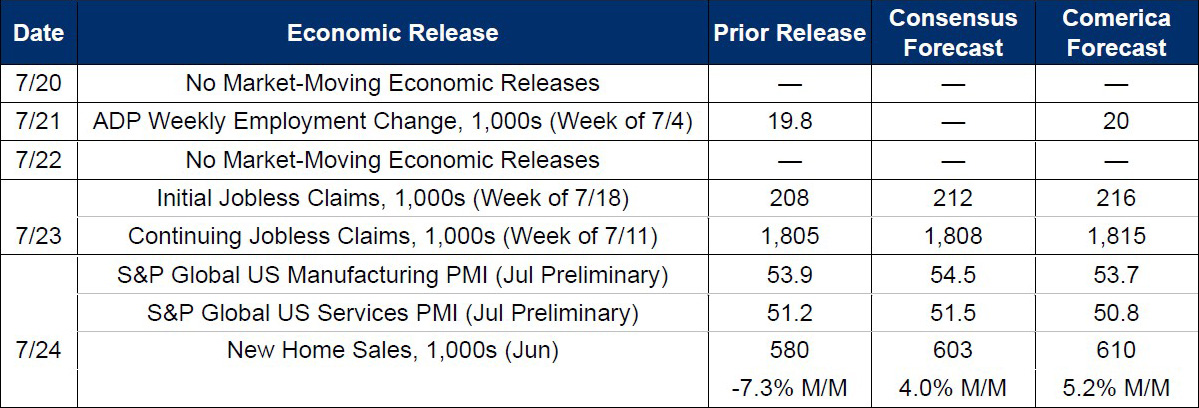
New home sales are the most important economic release in this light week for macro data. Sales likely rebounded in June after May’s drop, but were still down nearly 10% from a year earlier. 2026 has become another disappointing year for new home sales as high mortgage rates shrink the pool of potential buyers. The median new home price likely fell modestly from a year earlier after holding unchanged in May.
The flash release of S&P Global’s manufacturing PMI survey for July is forecast to show modestly slower growth as customers added less to inventories. The services PMI likely edged down, too, as the re-escalation of the Iran conflict weighed on new orders. The surveys will likely report that input-price inflation picked up from June as prices rose for crude oil, gasoline, diesel, jet fuel, and other refined products.
Last Week in Review
Inflation cooled even more than expected in June, helped both by lower energy prices and by tame trends in other goods and services. The CPI fell 0.4% from May, down by more than the consensus forecast, as gasoline prices fell a seasonally adjusted 9.7%. Core CPI excluding food and energy was flat on the month and slowed to 2.6% year over year, near the lowest since 2021. The CPI showed price declines across a range of core goods categories, likely reflecting actions by businesses that discounted to maintain turnover. Similarly, the PPI fell 0.3% while core PPI excluding foods, energy and trade services inched up 0.1%, both below consensus forecasts. Producer prices for May were revised down 0.4%. The Fed will likely view June’s better inflation data as supporting unchanged interest rates at the next decision near month-end.
Retail sales were robust in June. Although headline retail and food services sales growth slowed to 0.2%, the soft headline was due to a big drag from the 5.3% drop in gas station sales (Recall how gas prices plunged in the CPI report). Sales excluding gas stations surged 0.7%. Core sales excluding food services, gas stations, and autos rose 0.4%, implying volumes rose even more since core goods prices fell 0.1% in the CPI report. Control sales, the subset of core retail sales that the BEA uses to calculate nominal consumer spending in GDP, rose a solid 0.5%. Total and core sales for April and May were revised higher, too. From a year earlier, many discretionary categories posted excellent sales growth in June: Sporting goods, hobby, musical instrument, and bookstore sales rose 15.2%, nonstore sales rose 14.2%, electronics and appliance store sales rose 8.6%, and auto and other motor vehicle dealer sales rose 6.0%. Food services and drinking place sales were softer, up just 3.8% from a year earlier, and furniture and home furnishing sales were flat—but even that is an improvement after years of weakness as existing home sales faltered. The University of Michigan’s Consumer Sentiment Index rose to 54.4 in the preliminary July release from 49.5 in June.
Other activity indicators for June also grew, though not by as much as retail sales. Industrial production edged up 0.1%, a little below the 0.2% consensus forecast, while manufacturing production was flat on the month. From a year earlier, industrial production grew 1.1% as manufacturing also rose 1.1%, mining rose 2.4%, and utilities rose 0.3%. The capacity utilization rate was unchanged from May’s downwardly revised 76.1%. Volatile housing starts bounced 19.0% higher in June after a 15.2% drop in May. In the first half of the year, starts edged up 0.5% from 2025; single-family starts fell 5.3%, while multifamily starts in buildings with five or more units jumped 17.0%.
For a PDF version of this publication, click here: Comerica Economic Weekly, July 20, 2026
The articles and opinions in this publication are for general information only, are subject to change without notice, and are not intended to provide specific investment, legal, accounting, tax or other advice or recommendations. The information and/or views contained herein reflect the thoughts and opinions of the noted authors only, and such information and/or views do not necessarily reflect the thoughts and opinions of Comerica or its management team. This publication is being provided without any warranty whatsoever. Any opinion referenced in this publication may not come to pass. We are not offering or soliciting any transaction based on this information. You should consult your attorney, accountant or tax or financial advisor with regard to your situation before taking any action that may have legal, tax or financial consequences. Although the information in this publication has been obtained from sources we believe to be reliable, neither the authors nor Comerica guarantee its timeliness or accuracy, and such information may be incomplete or condensed. Neither the authors nor Comerica shall be liable for any typographical errors or incorrect data obtained from reliable sources or factual information.