
Key takeaways:
- The September jobs report was weaker than expected, on balance. Payrolls rose more than expected, but the trend still looks modest after downward revisions to July and August. Also, seasonality likely flattered job growth in September.
- The unemployment rate rose to the highest in almost four years. Cross-checks of the unemployment rate also sent negative signals.
- Private data sources suggest payrolls likely fell in October as the federal government shed workers.
- Fed policymakers have been talking down the odds of a cut at their next decision, but the September jobs report and other signs of a weakening labor market prod them in the other direction.
Payrolls rose more than expected in September, but other details of the jobs report were weaker, effectively cancelling out the upbeat signal from the headline. Nonfarm employment rose 119,000 from August, beating the 51,000 consensus forecast and Comerica’s forecast of 40,000. But job growth in July and August was revised down by 33,000 per month, meaning the three-month average of payrolls growth was a modest 62,000 in September; it was 29,000 in the August jobs report, which is now revised down to 18,000. The government shutdown delayed the release of the report, which was originally scheduled to come out in early October.
The unemployment rate rose to 4.4% in September (4.44% before rounding) from 4.3% in August and was the highest since October 2021. In the survey of households, employment rose 251,000, the labor force increased 470,000, and unemployment rose 219,000. The labor force participation rate edged up to 62.4% from 62.3% in August, and the “Prime-Age” participation rate for workers aged 25 to 54 held steady at 83.7%, but both ratios are down from a year earlier. The unemployment rate for White Americans rose to 3.8% from 3.7%, for Black or African Americans was unchanged at 7.5%, for Asian Americans rose to 4.4% from 3.6%, and for Hispanic or Latino ethnicity Americans rose to 5.5% from 5.3%. The labor force level for foreign-born workers edged down 166,000 on the month and was down 708,000 (-2.2%) from a year earlier, while the labor force of native-born workers is up 348,000 on the month and 3.356 million (+2.5%) from a year earlier. However, the BLS has historically made large revisions to data on workers’ place of birth after incorporating immigration data they receive from the Census Bureau after a long lag.
In the payrolls report, private industries added 97,000 workers, with goods-producing jobs up 10,000 and service-providing jobs up 87,000. Within goods-producing industries, mining and logging shed 3,000, construction added 19,000, and manufacturing shed 6,000. In service-providing industries, healthcare and social assistance added 57,000 jobs, leisure and hospitality added 47,000, retail added 14,000, and wholesale added 9,000 jobs. Transportation and warehousing shed 25,000 and professional and business services cut 20,000, of which 16,000 were temp jobs. Average hourly earnings rose 0.2% on the month and were up 3.8% on the year, close to the consensus forecast which estimated a 0.3% monthly gain but a 3.7% year-over-year gain. The average workweek held steady at 34.2 hours.
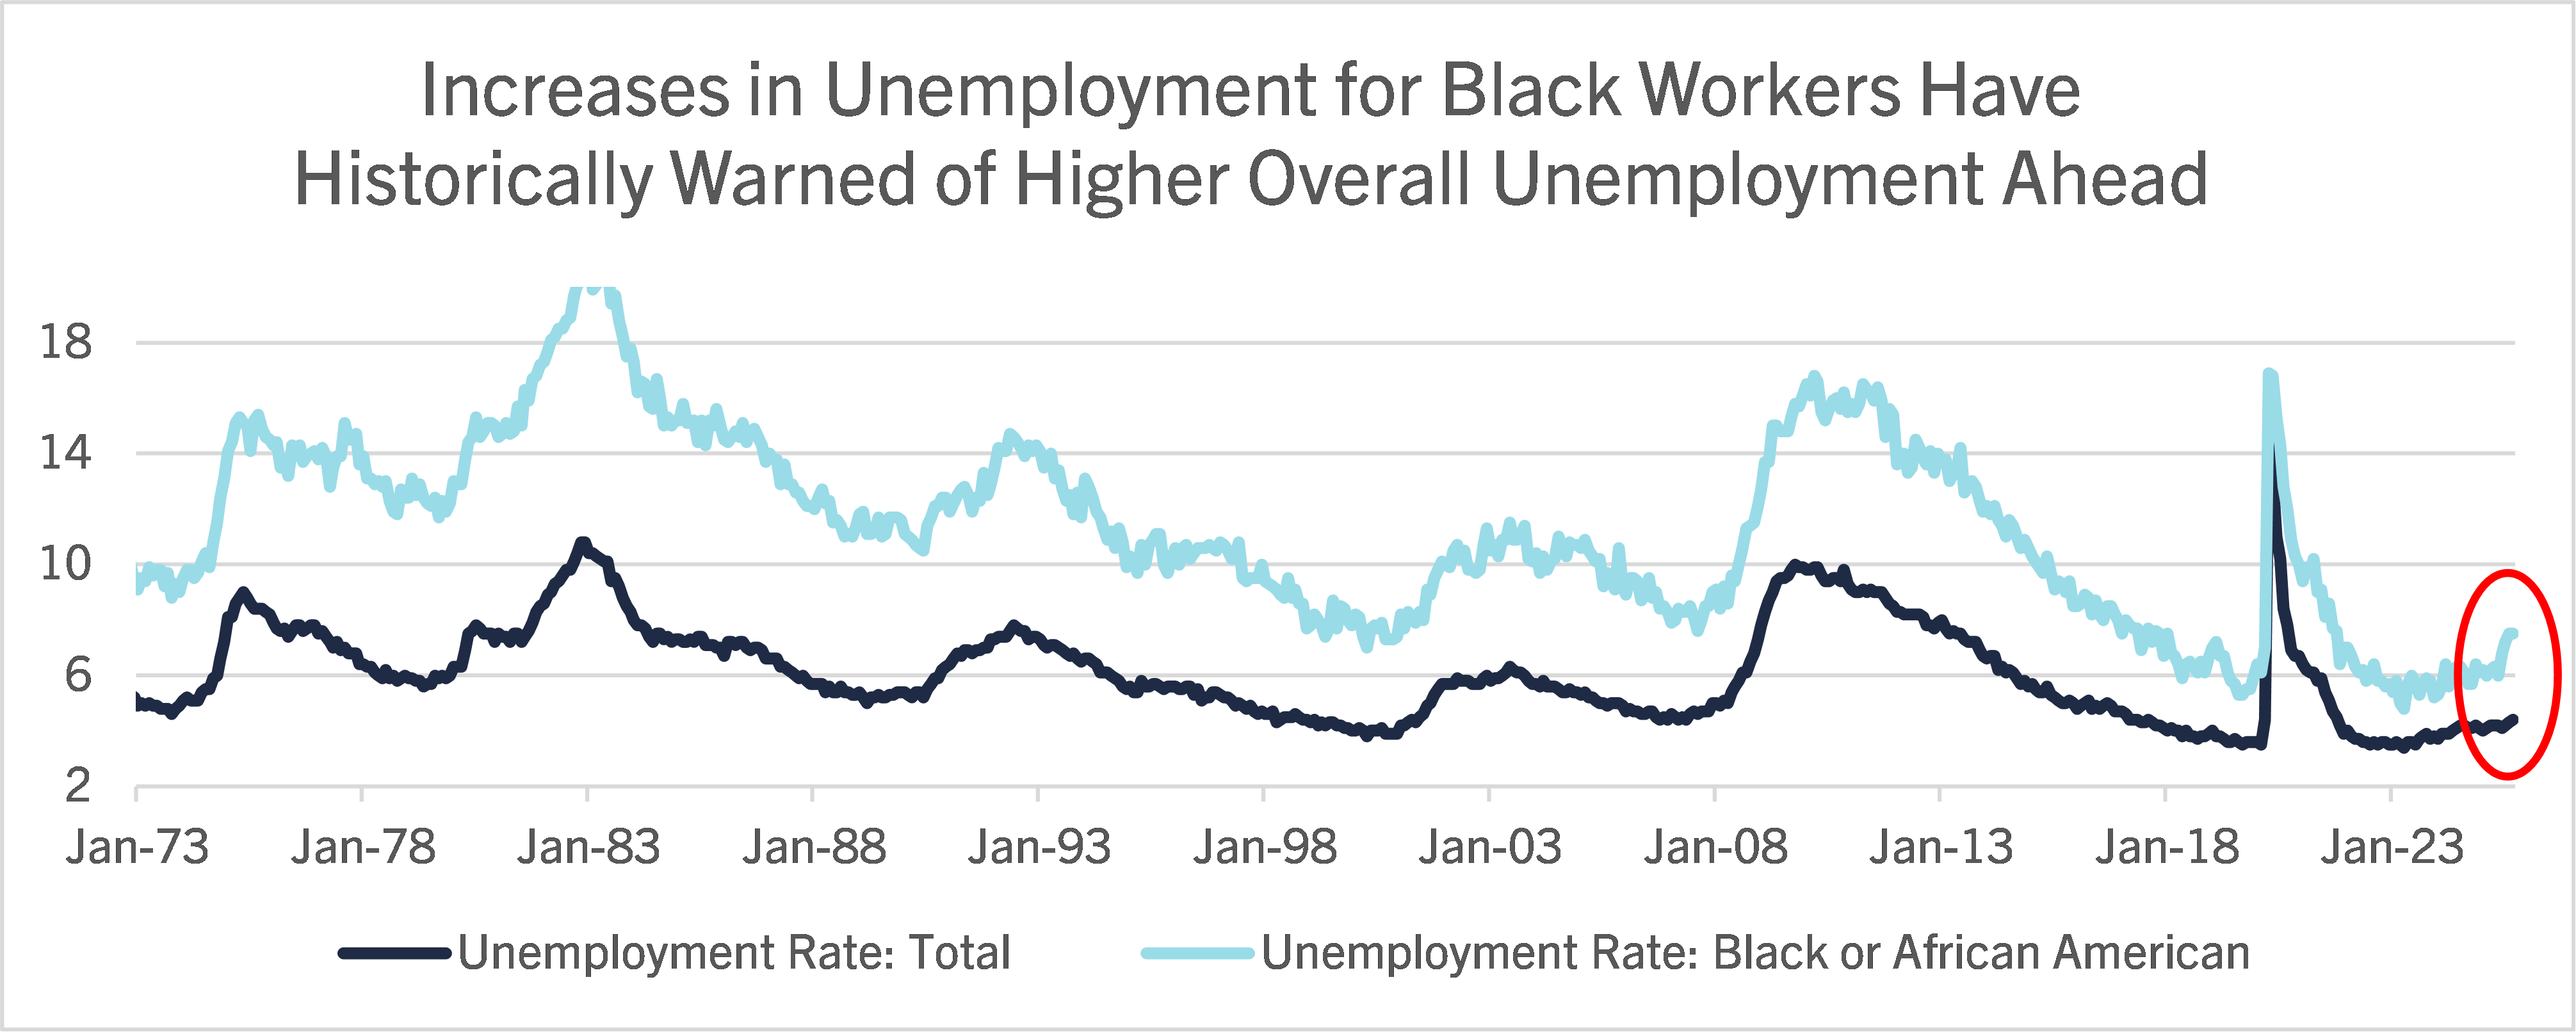
Since labor supply growth is slowing because of immigration policy, and labor demand is growing slower as well, the Fed has been talking more about the unemployment rate this year and de-emphasizing trends in payrolls. The unemployment rate’s latest increase shows that labor demand is not keeping up with labor supply. The forward-looking outlook is concerning, too. The unemployment rate of Black or African American workers is an eye-catching detail; it was up 1.5 percentage points from May in August and September. In past job market downturns, higher unemployment of Black or African American workers has been a leading indicator of higher unemployment ahead for all workers, so this is a flashing warning sign for the outlook. Another concerning detail from the household survey is that the labor force participation rate for teenagers (16-19 in the survey) was the lowest this summer since the pandemic. The teen unemployment rate fell in September, but that was because many young people gave up on finding work and returned to school. Likewise, details of the payroll survey suggest that the month’s uptick is unlikely to indicate an improvement in the trend. The end of the summer flattered job growth in leisure and hospitality and in retail, industries where many teenagers find summer work. Before adjusting for regular seasonal changes, leisure and hospitality employment averaged a 441,000 monthly decline in September between 2015 and 2024, and retail averaged a 104,000 drop as summer workers left payrolls. September 2025’s seasonally-adjusted increase means employment in these industries fell, but fell less than usual—and we should be careful about calling less down the new up. Also, healthcare and social assistance accounted for over 60% of job growth in the last twelve months despite comprising only 15% of payrolls; hiring is weak in industries that fluctuate more with the business cycle. Finally, payrolls revisions have been negative in seven out of last nine months, averaging a 44,000 markdown to the prior two months. These revisions are because businesses who report payrolls after the deadline for the BLS to finish the report had worse employment than businesses who submitted responses by the deadline. This pattern implies that future revisions are more likely to be negative than positive.
This long-delayed jobs report is the gold standard for measuring the labor market, but the Fed also is watching a range of more timely alternate data sources that show private job growth was weak in October as well, while the federal government likely shed 75,000 to 150,000 workers. Similar sources show that business hiring intentions are cooling and layoff plans increasing. Harder to quantify but possibly more important, AI adoption could weaken demand for white-collar workers in 2026. In the minutes of the Fed’s October decision, “most” FOMC members described the jobs backdrop as a “very gradual cooling,” but that seems too rosy after the September jobs report, as well as alternate data released during the shutdown. The BLS is delaying the release of the November jobs report because of the shutdown, so Fed policymakers won’t be able to review it before their next decision December 10. That will force them to put more emphasis on the September report, as well as alternate estimates of job growth for November from the private data sources which influenced their decision to cut in October.
Fed policymakers have been talking down the likelihood of additional rate cuts near-term after the October decision, and for understandable reasons. The minutes of their October meeting showed a good deal of harrumphing about stock market valuations. Policymakers don’t want to add fuel to that fire. It’s natural for the Fed to keep a stiff upper lip in the face of pressure on their independence from the White House. Not least among their considerations, inflation continues to exceed their target due to tariff pass-through and upward pressures on meat prices from climate and disease. Even so, Comerica sees the softening jobs market as making a rate cut more likely than not at the Fed’s December decision. Financial markets priced in about seven in ten odds of a cut in December on November 21, the day after the jobs report’s release.
For a PDF version of this publication, click here: Unemployment Rose to Highest
The articles and opinions in this publication are for general information only, are subject to change without notice, and are not intended to provide specific investment, legal, accounting, tax or other advice or recommendations. The information and/or views contained herein reflect the thoughts and opinions of the noted authors only, and such information and/or views do not necessarily reflect the thoughts and opinions of Comerica or its management team. This publication is being provided without any warranty whatsoever. Any opinion referenced in this publication may not come to pass. We are not offering or soliciting any transaction based on this information. You should consult your attorney, accountant or tax or financial advisor with regard to your situation before taking any action that may have legal, tax or financial consequences. Although the information in this publication has been obtained from sources we believe to be reliable, neither the authors nor Comerica guarantee its timeliness or accuracy, and such information may be incomplete or condensed. Neither the authors nor Comerica shall be liable for any typographical errors or incorrect data obtained from reliable sources or factual information.